Thursday, March 27, 2025

Postgres 17.4 vs sysbench on a large server, revisited part 2

I recently shared two posts (here and here) with results for sysbench on a large server using Postgres versions 10 through 17. In general there were several large improvements over time, but one small regression that arrived in Postgres 11.x. This blog post provides more details on the problem using results from Postgres 10.23, 11.22 and 17.4.

The regression occurs starting in Postgres 11.22 because Postgres is more likely to use bitmap index scan starting in 11.x. I have yet to learn why or how to prevent that.

Index scan vs bitmap index scan

Experts gave me great advice based on a few flamegraphs that I shared. It looked like Postgres started to use bitmap index scan more often starting in Postgres 11. Upstream sysbench does collect query plans for the SQL that it uses, so I modified my fork to do that.

While the explain output helps, it would help even more were there a feature in Postgres to provide optimizer traces, similar to what MySQL has, to understand why some query plans are selected and others are rejected. Another feature request is to improve the official Postgres docs to provide more detail on 1) the difference between index scan and bitmap index scan and 2) the difference between lossy and non-lossy bitmap index scans (AFAIK, one needs recheck).

The problem microbenchmark

The microbenchmarks in question do a range scan with aggregation and have a name like read-only_range=$X where X has been 10, 100 and 1000 but here I use X in 10, 100, 1000, 2000, 4000, 8000, 16000 and 32000. The value of X is the length of the range scan. These are run via oltp_read_only.lua and use these SQL statements.

Build, configuration, hardware, benchmark

These are described in my previous post. But a few things have changed for this report

  • I only tested Postgres versions 10.23, 11.22 and 17.4
  • I ran the read-only_range=$X microbenchmark for X in 10, 100, 1000, 2000, 4000, 8000, 16000 and 32000. Previously I ran it for X in 10, 100, 10000
  • I added new tests that each run only one of the SQL statements used by oltp_read_only.lua. All of the Lua scripts are here.
What didn't change is that the tests are run with 8 tables and 10M rows/table, read-heavy microbenchmarks run for 180 seconds and write-heavy run for 300 seconds.

The benchmark was repeated using configurations with work_mem set to 1MB, 2MB, 4MB, 8MB, 16MB and 32MB. The configuration files are here.

Query plans

This table shows that plans with bitmap index are far more frequent starting in Postgres 11. The numbers are similar if I count the number of occurrences of recheck.

The following show the number of occurrences of "bitmap index" in explain output for the read-only.range=X microbenchmarks. For read-only.range=1000 and read-only.range=2000 the counts are always 0. Note that the regressions are there at range=8000 and mostly don't occur for other values of range=X. It is interesting that 10.23 is least likely to use plans with bitmap index while 17.4 is most likely.

For read-only.range=4000
dbms      1        2      4       8       16      32 -> work_mem(MB)
10.23     0        0      0       0        0       0
11.22     0        0      0       0        0       0
17.4    723     1020    635     935     1059    1008

For read-only.range=8000
dbms       1       2       4       8      16      32 -> work_mem(MB)
10.23     40       0       1       0       0     166
11.22   1133    1237    1044    1252    1280    1231
17.4    1280    1278    1279    1280    1280    1280

For read-only.range=16000
dbms       1       2       4       8      16      32 -> work_mem(MB)
10.23   1279    1279    1279    1278    1278    1278
11.22   1280    1280    1279    1279    1280    1278
17.4    1279    1280    1279    1279    1279    1279

Example plans for distinct_range

The read-only.range=8000 test uses 4 types of SQL aggregation queries - distinct_range, order_range, simple_range and sum_range. This section has example plans for distinct_range at work_mem=16M.

Below I show that the regressions are largest for sum_range and simple_range and much smaller for distinct_range and order_range -- while plans for all of these are switching from index scan to bitmap index scan.

Postgres 10.23
explain SELECT DISTINCT c FROM sbtest1 WHERE id BETWEEN 4087499 AND 4095498 ORDER BY c
Unique  (cost=28211.06..28250.59 rows=7907 width=121)
  ->  Sort  (cost=28211.06..28230.82 rows=7907 width=121)
        Sort Key: c
        ->  Index Scan using sbtest1_pkey on sbtest1  (cost=0.43..27699.12 rows=7907 width=121)
              Index Cond: ((id >= 4087499) AND (id <= 4095498))

Postgres 11.22
explain SELECT DISTINCT c FROM sbtest1 WHERE id BETWEEN 1359956 AND 1367955 ORDER BY c
Unique  (cost=29781.72..29823.36 rows=8327 width=121)
  ->  Sort  (cost=29781.72..29802.54 rows=8327 width=121)
        Sort Key: c
        ->  Bitmap Heap Scan on sbtest1  (cost=269.79..29239.49 rows=8327 width=121)
              Recheck Cond: ((id >= 1359956) AND (id <= 1367955))
              ->  Bitmap Index Scan on sbtest1_pkey  (cost=0.00..267.70 rows=8327 width=0)
                    Index Cond: ((id >= 1359956) AND (id <= 1367955))

Postgres 17.4
explain SELECT DISTINCT c FROM sbtest1 WHERE id BETWEEN 8646394 AND 8654393 ORDER BY c
Unique  (cost=31903.86..31949.03 rows=9033 width=121)
  ->  Sort  (cost=31903.86..31926.45 rows=9033 width=121)
        Sort Key: c
        ->  Bitmap Heap Scan on sbtest1  (cost=193.02..31310.35 rows=9033 width=121)
              Recheck Cond: ((id >= 8646394) AND (id <= 8654393))
              ->  Bitmap Index Scan on sbtest1_pkey  (cost=0.00..190.76 rows=9033 width=0)
                    Index Cond: ((id >= 8646394) AND (id <= 8654393))

Example plans for order_range

The read-only.range=8000 test uses 4 types of SQL aggregation queries - distinct_range, order_range, simple_range and sum_range. This section has example plans for order_range at work_mem=16M.

Below I show that the regressions are largest for sum_range and simple_range and much smaller for distinct_range and order_range -- while plans for all of these are switching from index scan to bitmap index scan.

Postgres 10.23
table 1 : explain SELECT c FROM sbtest1 WHERE id BETWEEN 9271446 AND 9279445 ORDER BY c
Sort  (cost=26775.57..26794.32 rows=7501 width=121)
  Sort Key: c
  ->  Index Scan using sbtest1_pkey on sbtest1  (cost=0.43..26292.77 rows=7501 width=121)
        Index Cond: ((id >= 9271446) AND (id <= 9279445))

Postgres 11.22
explain SELECT c FROM sbtest1 WHERE id BETWEEN 9375999 AND 9383998 ORDER BY c
Sort  (cost=30444.65..30465.97 rows=8529 width=121)
  Sort Key: c
  ->  Bitmap Heap Scan on sbtest1  (cost=275.86..29887.79 rows=8529 width=121)
        Recheck Cond: ((id >= 9375999) AND (id <= 9383998))
        ->  Bitmap Index Scan on sbtest1_pkey  (cost=0.00..273.73 rows=8529 width=0)
              Index Cond: ((id >= 9375999) AND (id <= 9383998))

Postgres 17.4
explain SELECT c FROM sbtest1 WHERE id BETWEEN 8530681 AND 8538680 ORDER BY c
Sort  (cost=27548.18..27567.43 rows=7701 width=121)
  Sort Key: c
  ->  Bitmap Heap Scan on sbtest1  (cost=167.37..27051.05 rows=7701 width=121)
        Recheck Cond: ((id >= 8530681) AND (id <= 8538680))
        ->  Bitmap Index Scan on sbtest1_pkey  (cost=0.00..165.44 rows=7701 width=0)
              Index Cond: ((id >= 8530681) AND (id <= 8538680))

Example plans for simple_range

The read-only.range=8000 test uses 4 types of SQL aggregation queries - distinct_range, order_range, simple_range and sum_range. This section has example plans for simple_range at work_mem=16M.

Below I show that the regressions are largest for sum_range and simple_range and much smaller for distinct_range and order_range -- while plans for all of these are switching from index scan to bitmap index scan.

Postgres 10.23
explain SELECT c FROM sbtest1 WHERE id BETWEEN 7681343 AND 7689342
Index Scan using sbtest1_pkey on sbtest1  (cost=0.43..28016.13 rows=7999 width=121)
  Index Cond: ((id >= 7681343) AND (id <= 7689342))

Postgres 11.22
explain SELECT c FROM sbtest1 WHERE id BETWEEN 1406209 AND 1414208
Bitmap Heap Scan on sbtest1  (cost=250.91..27065.17 rows=7656 width=121)
  Recheck Cond: ((id >= 1406209) AND (id <= 1414208))
  ->  Bitmap Index Scan on sbtest1_pkey  (cost=0.00..249.00 rows=7656 width=0)
        Index Cond: ((id >= 1406209) AND (id <= 1414208))

Postgres 17.4
explain SELECT c FROM sbtest1 WHERE id BETWEEN 5487727 AND 5495726
Bitmap Heap Scan on sbtest1  (cost=170.27..27961.99 rows=7984 width=121)
  Recheck Cond: ((id >= 5487727) AND (id <= 5495726))
  ->  Bitmap Index Scan on sbtest1_pkey  (cost=0.00..168.28 rows=7984 width=0)
        Index Cond: ((id >= 5487727) AND (id <= 5495726))

Example plans for sum_range

The read-only.range=8000 test uses 4 types of SQL aggregation queries - distinct_range, order_range, simple_range and sum_range. This section has example plans for sum_range at work_mem=16M.

Below I show that the regressions are largest for sum_range and simple_range and much smaller for distinct_range and order_range -- while plans for all of these are switching from index scan to bitmap index scan.

Postgres 10.23
explain SELECT SUM(k) FROM sbtest1 WHERE id BETWEEN 1117274 AND 1125273
Aggregate  (cost=27542.60..27542.61 rows=1 width=8)
  ->  Index Scan using sbtest1_pkey on sbtest1  (cost=0.43..27522.96 rows=7856 width=4)
        Index Cond: ((id >= 1117274) AND (id <= 1125273))

Postgres 11.22
explain SELECT SUM(k) FROM sbtest1 WHERE id BETWEEN 2318912 AND 2326911
Aggregate  (cost=28030.44..28030.45 rows=1 width=8)
  ->  Bitmap Heap Scan on sbtest1  (cost=257.90..28010.57 rows=7948 width=4)
        Recheck Cond: ((id >= 2318912) AND (id <= 2326911))
        ->  Bitmap Index Scan on sbtest1_pkey  (cost=0.00..255.92 rows=7948 width=0)
              Index Cond: ((id >= 2318912) AND (id <= 2326911))

Postgres 17.4
explain SELECT SUM(k) FROM sbtest1 WHERE id BETWEEN 1795996 AND 1803995
Aggregate  (cost=27179.49..27179.50 rows=1 width=8)
  ->  Bitmap Heap Scan on sbtest1  (cost=167.72..27160.16 rows=7735 width=4)
        Recheck Cond: ((id >= 1795996) AND (id <= 1803995))
        ->  Bitmap Index Scan on sbtest1_pkey  (cost=0.00..165.79 rows=7735 width=0)
              Index Cond: ((id >= 1795996) AND (id <= 1803995))

Results

While there are normally ~27 microbenchmarks (each microbenchmark uses sysbench to run tests from one Lua file) I added a few extra tests this time and I only share results from the read-only* microbenchmarks. Output from all tests is here.

The numbers below are the relative QPS which is the following where $version is either 11.22 or 17.4. When the relative QPS is < 1.0, then $version is slower than Postgres 10.23.
(QPS for $version) / (QPS for Postgres 10.23)

A summary of the results is:

  • the regression always occurs for the range=8000 microbenchmark and is less likely for other values for range=X. Note that range=X means the queries scan X rows.
  • from the four tests that each run only one of the SQL aggregation queries used by the standard read-only microbenchmark (read-only-distinct, read-only-order, read-only-simple and read-only-sum) the regression occurs in read-only-simple and read-only-sum but not in the others and the regression is the largest in read-only-sum. The SQL statements are here for read-only-distinct, read-only-order, read-only-simple and read-only-sum.

work_mem 1 MB
1.03    1.06    read-only_range=10
1.02    1.04    read-only_range=100
1.00    1.00    read-only_range=1000
1.00    1.02    read-only_range=2000
1.00    0.99    read-only_range=4000
0.95    0.95    read-only_range=8000
0.99    1.02    read-only_range=16000
1.00    1.04    read-only_range=32000
0.98    0.97    read-only-distinct_range=8000
0.98    0.99    read-only-order_range=8000
0.94    0.90    read-only-simple_range=8000
0.89    0.83    read-only-sum_range=8000

work_mem 2 MB
11.22   17.4
1.02    1.06    read-only_range=10
1.01    1.02    read-only_range=100
1.00    0.99    read-only_range=1000
0.99    1.01    read-only_range=2000
0.98    0.96    read-only_range=4000
0.94    0.93    read-only_range=8000
0.99    1.00    read-only_range=16000
0.98    1.02    read-only_range=32000
0.97    0.96    read-only-distinct_range=8000
0.96    0.98    read-only-order_range=8000
0.92    0.89    read-only-simple_range=8000
0.86    0.80    read-only-sum_range=8000


work_mem 4 MB
11.22   17.4
1.02    1.06    read-only_range=10
1.02    1.03    read-only_range=100
1.01    1.01    read-only_range=1000
1.00    1.02    read-only_range=2000
1.00    1.00    read-only_range=4000
0.96    0.94    read-only_range=8000
1.13    1.24    read-only_range=16000
1.06    1.11    read-only_range=32000
0.98    0.97    read-only-distinct_range=8000
0.98    0.99    read-only-order_range=8000
0.94    0.90    read-only-simple_range=8000
0.89    0.82    read-only-sum_range=8000


work_mem 8 MB
11.22   17.4
1.03    1.07    read-only_range=10
1.02    1.03    read-only_range=100
1.00    0.99    read-only_range=1000
1.00    1.01    read-only_range=2000
0.99    0.97    read-only_range=4000
0.95    0.94    read-only_range=8000
0.99    1.00    read-only_range=16000
0.99    1.03    read-only_range=32000
0.97    0.96    read-only-distinct_range=8000
0.97    0.98    read-only-order_range=8000
0.92    0.89    read-only-simple_range=8000
0.87    0.81    read-only-sum_range=8000


work_mem 16 MB
11.22   17.4
1.04    1.08    read-only_range=10
1.03    1.05    read-only_range=100
1.00    1.00    read-only_range=1000
1.00    1.02    read-only_range=2000
0.99    0.97    read-only_range=4000
0.94    0.94    read-only_range=8000
0.98    1.00    read-only_range=16000
0.99    1.03    read-only_range=32000
0.97    0.96    read-only-distinct_range=8000
0.97    0.99    read-only-order_range=8000
0.92    0.90    read-only-simple_range=8000
0.86    0.80    read-only-sum_range=8000


work_mem 32 MB
11.22   17.4
1.02    1.06    read-only_range=10
1.01    1.03    read-only_range=100
1.00    1.00    read-only_range=1000
0.99    1.02    read-only_range=2000
1.00    0.97    read-only_range=4000
0.95    0.94    read-only_range=8000
0.99    1.01    read-only_range=16000
0.99    1.04    read-only_range=32000
0.97    0.96    read-only-distinct_range=8000
0.97    0.99    read-only-order_range=8000
0.94    0.90    read-only-simple_range=8000
0.89    0.83    read-only-sum_range=8000

Sunday, March 16, 2025

At what level of concurrency do MySQL 5.7 and 8.0 become faster than 5.6?

Are MySQL 5.7 and 8.0 faster than 5.6? That depends a lot on the workload -- both types of SQL and amount of concurrency. Here I summarize results from sysbench on a larger server (48 cores) using 1, 4, 6, 8, 10, 20 and 40 clients to show how things change.

tl;dr

  • the workload here is microbenchmarks with a database cached by InnoDB
  • 5.7.44 is faster than 8.0.x at all concurrency levels on most microbenchmarks
  • for 5.6.51 vs 8.0.x
    • for point queries, 5.6.51 is faster at <= 8 clients
    • for range queries without aggregation 5.6.51 is always faster
    • for range queries with aggregation 5.6.51 is faster except at 40 clients
    • for writes, 5.6.51 is almost always faster at 10 or fewer clients (excluding update-index)
Performance summaries

For point queries:
  • 5.7.44 is always faster than 8.0
  • 8.0.28 suffers from bug 102037 - found by me with sysbench, fixed in 8.0.31
  • at what level of concurrency do most things get faster in 5.7 & 8.0 vs 5.6?
    • 5.7.44 becomes faster than 5.6.51 at 6+ clients
    • 8.0.x becomes faster than 5.6.51 at between 10 and 20 clients
    • Two of the microbenchmarks are always faster in 5.6.51 - both do non-covering queries on a secondary index
For range queries without aggregation
  • 5.7.44 is always faster than 8.0x
  • 5.6.51 is always faster than 5.7.44 and 8.0.x
For range queries with aggregation
  • 5.7.44 is almost always faster than 8.0.x
  • 5.7.44 becomes faster than 5.6.51 at 6+ clients
  • 8.0.x becomes faster than 5.6.51 at 40 clients
For writes
  • For update-index
    • 5.7.44 and 8.0.x are always faster than 5.6.51 at 4+ clients
    • There is an odd drop from ~6X to ~3X for 8.0.32 and 8.0.39 at 20 clients
  • 5.7.44 is mostly faster than 8.0.x for 1 to 20 clients and they have similar results at 40 clients
  • 5.7.44 & 8.0.x are always faster than 5.6.51 at 20+ clients
Builds, configuration and hardware

I compiled MySQL from source for versions 5.6.51, 5.7.44, 8.0.28, 8.0.32, 8.0.39 and 8.0.41.

The server is an ax162-s from Hetzner with 48 cores (AMD EPYC 9454P), 128G RAM and AMD SMT disabled. It uses Ubuntu 22.04 and storage is ext4 with SW RAID 1 over 2 locally attached NVMe devices. More details on it are here. At list prices a similar server from Google Cloud costs 10X more than from Hetzner.

The configuration files are named my.cnf.cz11a_c32r128 and here for 5.6.51, 5.7.44, 8.0.28, 8.0.32, 8.0.39 and 8.0.41.

Benchmark

I used sysbench and my usage is explained here. To save time I only run 27 of the 42 microbenchmarks and most test only 1 type of SQL statement. Benchmarks are run with the database cached by InnoDB.

The tests run with 8 tables and 10M rows/table. There are 40 client threads, read-heavy microbenchmarks run for 180 seconds and write-heavy run for 300 seconds.

The command lines to run all tests are:
bash r.sh 8 10000000 180 300 md2 1 1 1
bash r.sh 8 10000000 180 300 md2 1 1 4
bash r.sh 8 10000000 180 300 md2 1 1 6
bash r.sh 8 10000000 180 300 md2 1 1 8
bash r.sh 8 10000000 180 300 md2 1 1 10
bash r.sh 8 10000000 180 300 md2 1 1 20
bash r.sh 8 10000000 180 300 md2 1 1 40

Results

For the results below I split the microbenchmarks into 4 groups: point queries, range queries without aggregation, range queries with queries, writes. The spreadsheet with all data is here. Files with performance summaries for relative and absolute QPS are hereValues from iostat and vmstat per microbenchmark are here for 1 client, 4 clients, 6 clients, 8 clients, 10 clients, 20 clients and 40 clients. These help to explain why something is faster or slower because it shows how much HW is used per query.

The relative QPS is the following where $version is >= 5.7.44.
(QPS for $version) / (QPS for MySQL 5.6.51)
The numbers in the spreadsheets are the relative QPS. When the relative QPS is > 1 then $version is faster than MySQL 5.6.51. When it is 3.0 then $version is 3X faster than the base case.

Results: charts 

Notes on the charts

  • the y-axis shows the relative QPS
  • the y-axis starts at 0.80 to make it easier to see differences
  • in some cases the y-axis truncates the good outliers, cases where the relative QPS is greater than 1.5. I do this to improve readability for values near 1.0. Regardless, the improvements are nice.
Results: point queries

Summary
  • 5.7.44 is always faster than 8.0
  • 8.0.28 suffers from bug 102037 - found by me with sysbench, fixed in 8.0.31
  • at what level of concurrency do most things get faster in 5.7 & 8.0 vs 5.6?
    • 5.7.44 becomes faster than 5.6.51 at 6+ clients
    • 8.0.x becomes faster than 5.6.51 at between 10 and 20 clients
    • Two of the microbenchmarks are always faster in 5.6.51 - both do non-covering queries on a secondary index
Results: range queries without aggregation

Summary
  • 5.7.44 is always faster than 8.0x
  • 5.6.51 is always faster than 5.7.44 and 8.0.x
Results: range queries with aggregation

Summary
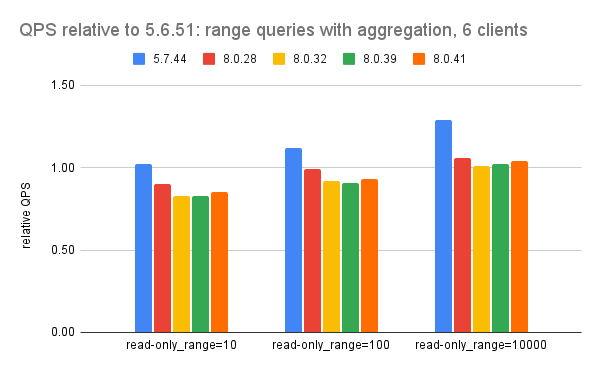
  • 5.7.44 is almost always faster than 8.0.x
  • 5.7.44 becomes faster than 5.6.51 at 6+ clients
  • 8.0.x becomes faster than 5.6.51 at 40 clients
Results: writes

The relative speedup for the update-index microbenchmark is frequently so large that it obscures the smaller changes on other microbenchmarks. So here I truncate the y-axis for some of the charts (for 6+ clients) and the section that follows has the charts without truncation.

Summary
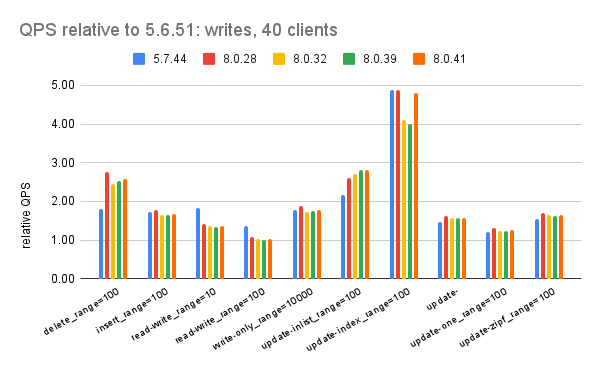
  • For update-index
    • 5.7.44 and 8.0.x are always faster than 5.6.51 at 4+ clients
    • There is an odd drop from ~6X to ~3X for 8.0.32 and 8.0.39 at 20 clients but you can't see that on the charts in this section because of the truncation. It is visible in the next section. From vmstat I see an increase in CPU/operation (cpu/o) and context switches /operation (cs/o) at 20 clients but not at 40 clients.
  • 5.7.44 is mostly faster than 8.0.x for 1 to 20 clients and they have similar results at 40 clients
  • 5.7.44 & 8.0.x are always faster than 5.6.51 at 20+ clients
Results: charts for writes without truncation

The y-axis is truncated the the charts for writes in the previous section for 6+ clients. This section has those charts without truncation.

Saturday, March 15, 2025

Postgres 17.4 vs sysbench on a large server, revisited

I recently shared results for Postgres vs sysbench on a large server. The results were mostly boring (it is rare for me to spot regressions in Postgres) but there was one microbenchmark where there was a problem. The problem microbenchmark does a range scan with aggregation and the alleged regression arrived in Postgres 11. With advice from Postgres experts it looked like the problem was an intermittent change in the query plan.

In this post I explain additional tests that I did and in this case the alleged regression was still there, but like many things in DBMS-land it depends, there is nuance. For now I assume the problem is from a change in the query plan and I will run more tests with more instrumentation to investigate that. Here the alleged regression might be ~5% and only at the highest concurrency level (40. clients).

Postgres the DBMS and community are not fans of query plan hints and the sysbench tests that I use don't add hints for queries. Query plan hints are possible in Postgres via the pg_hint_plan extension.  Query plan hints have been good to me with web-scale MySQL. For some of the web-scale workloads that I support the SQL and schema doesn't change much and query plan hints have two benefits -- plan stability and CPU reduction. By CPU reduction I mean that the CPU overhead from the optimizer is reduced because it has less work to do.

tl;dr

  • There might be a regression for some range queries, but it is small here (~5%) and only occurs at the highest concurrency level (40 clients). I assume this is from a change in the query plan.
  • I have yet to explain the alleged regression
  • I like query plan hints

The problem microbenchmark

The microbenchmarks in question do a range scan with aggregation and have a name like read-only_range=$X where X has been 10, 100 and 1000. The value of X is the length of the range scan. These are run via oltp_read_only.lua and uses these SQL statements.

Build, configuration, hardware, benchmark

These are described in my previous post. But a few things have changed for this report

  • I only tested Postgres versions 10.23, 11.0 and 11.10
  • I repeated the benchmark for 1, 10, 20 and 40 client threads. Previously I only ran it for 40.
  • I ran the read-only_range=$X microbenchmark for X in 10, 100, 1000, 2000, 4000, 8000, 16000 and 32000. Previously I ran it for X in 10, 100, 10000.
What didn't change is that the tests are run with 8 tables and 10M rows/table, read-heavy microbenchmarks run for 180 seconds and write-heavy run for 300 seconds.

Results: overview

For the results below I split the microbenchmarks into 4 groups -- 1 for point queries, 2 for range queries, 1 for writes. For the range query microbenchmarks, one group has queries without aggregation and the other has queries with aggregation. The spreadsheet with all data and charts is here. It has a tab for 1, 10, 20 and 40 clients (named dop=$X for X in 1, 10, 20 and 40).

Files with performance summaries are here. These include summaries of results from vmstat and iostat for each microbenchmark which are here for 1 client, 10 clients, 20 clients and 40 clients.

The relative QPS is the following where $version is either 11.0 or 11.10.
(QPS for $version) / (QPS for Postgres 10.23)
The numbers in the spreadsheets are the relative QPS. When the relative QPS is > 1 then $version is faster than Postgres 10.23.  When it is 3.0 then $version is 3X faster than the base case.

Notes on the charts

  • the y-axis shows the relative QPS
  • the y-axis starts at 0.90 to make it easier to see differences
  • there are 4 charts per section, one for each of 1, 10, 20 and 40 clients
Results: point queries

Summary
  • Postgres 11.x is always faster than 10.23 and usually about 3% faster
Results: range queries without aggregation

Summary
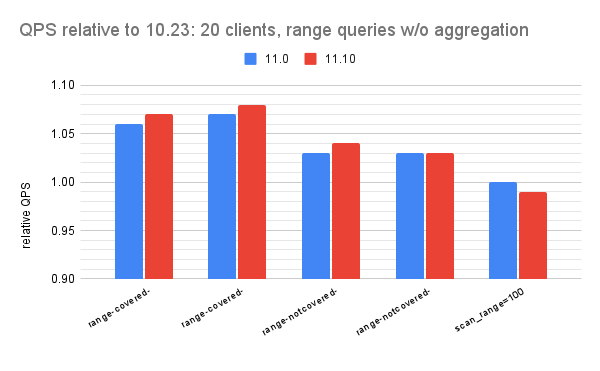
  • There are no regressions
  • Postgres 11.0 & 11.10 get up to 11% more QPS than 10.23 for the range-covered and range-notcovered microbenchmarks
  • For the scan microbenchmark QPS is mostly unchanged between Postgres 10.23, 11.0 and 11.10 but in one cases Postgres 11 was slightly slower (relative QPS for 11.0 was 0.99 at 20 clients). 
Results: range queries with aggregation

I repeated the read-only microbenchmark using range queries of length 10, 100, 1000, 2000, 4000, 8000, 16000 and 32000.

Summary:
  • In general, the advantage for Postgres 11.0 & 11.10 vs 10.23 was largest for the longest range scans (16000 & 32000) and next largest for the shortest range scans (10 & 100).
  • The comparison for range scans of length 1000, 2000, 4000 and 8000 was interesting. Here the benefit for Postgres 11.0 & 11.10 was not as large and in one case (range=8000 at 40 clients) there was a small regression (~5%). Perhaps there is a change in the query plan.
Results: writes

Summary:
  • Postgres 11.0 & 11.10 were almost always faster than 10.23 and up to 1.75X faster
  • In one case (update-one microbenchmark at 20 clients) Postgres 11.0 & 11.10 were ~5% slower than 10.23. And this is odd because 11.0 and 11.10 were ~1.7X faster at 40 clients on the same microbenchmark. I can only wave my hands for this one. But don't think this is a regression.
    • The update-one microbenchmark is run by oltp_update_non_index.lua (the name means it updates non-indexed columns), the SQL for the update is here and the schema is here.
    • From vmstat and iostat metrics for 20 clients and for 40 clients and looking at the CPU /operation (cpu/o) and context switches /operation (cs/o)
      • For 20 clients these are slightly larger for 11.0 & 11.10 vs 10.23
      • For 40 clients these are significantly small for 11.0 & 11.10 vs 10.23
    • The microbenchmarks that aren't read-only are run for 600 seconds each and it is possible for performance variance to come from write debt (writeback, vacuum, etc) inherited from microbenchmarks that preceded update-one. The order in which the update microbenchmarks are run is here and is update-inlist, update-index, update-nonindex, update-one, update-zipf. From the dop=20 tab on the spreadsheet, throughput is 1.1X to 1.3X larger for the 3 update microbenchmarks that precede update-one so inherited write debt might explain this results.

Postgres 17.4 vs sysbench on a large server, revisited part 2

I recently shared two posts ( here and here ) with results for sysbench on a large server using Postgres versions 10 through 17. In general...